We recently upgraded from Java 8 to 17 and in doing so we switched Hibernate Core from 5.4.17.Final to 6.5.3.Final. Now we encountered this weird bug, when a QueryDSL query gets executed for the first time it takes way more time it did before the upgrade.
Before the upgrade when the query got executed the first time it also did take more time than on consecutive calls, but now it takes way more time - like by a factor of 100. If this query is executed again (even with different parameters) the performance is back to normal and it takes less than 50ms.
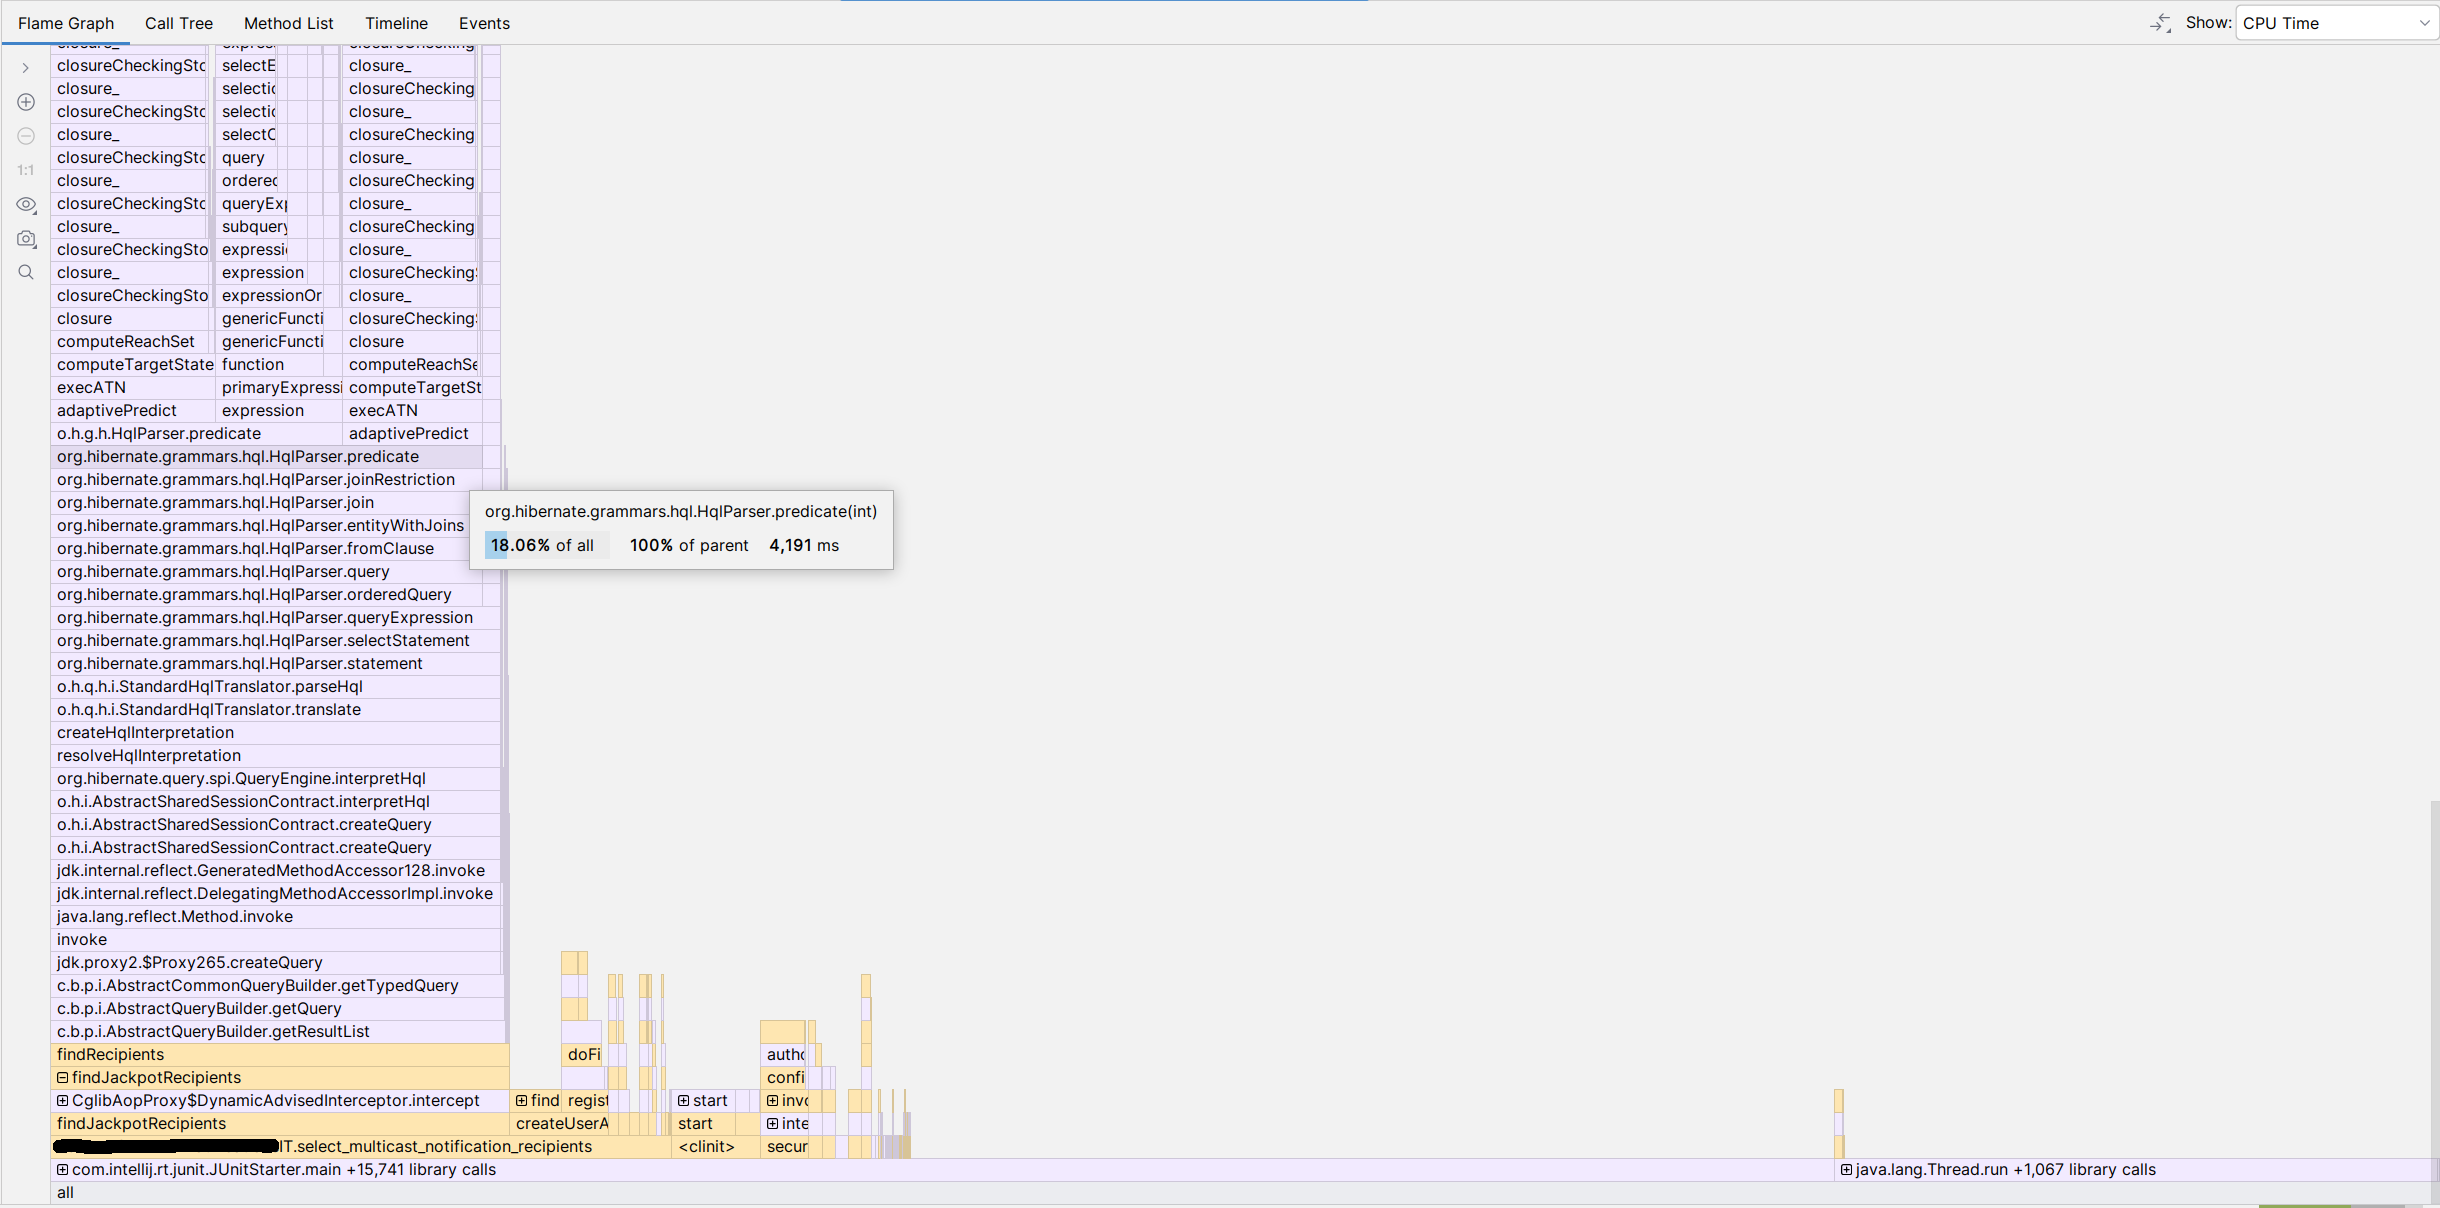
The method com.querydsl.jpa.impl.AbstractJPAQuery.fetch() took ~95% of all after the upgrade whereas before the upgrade it took only ~30% of all. In addition, there are now many calls to the Antlr library that weren’t there before.
Im not sure if the problem is in Hibernate or in QueryDSL because before the upgrade we used QueryDSL 4.3.1. But after the upgrade we had to switch QueryDSL 5.1.0 (because of jakarta). (I even tested with the QueryDSL OpenFeign fork 6.8 but had the same results.) Therefore, I can’t test it with the older QueryDSL version - or is there a way?
The generated SQL looks kinda the same, but I don’t suspect it’s the SQL because for the second and consecutive executions the performance is good.
Do you have any idea what else I could check? I’m grateful for any advice!
What are these flamegraph measuring, the wall-clock time for each call? I find it very weird ANTLr parsing takes ~1.5 seconds, could you please paste the query string it’s trying to process?
You could try comparing a pure Hibernate application (without QueryDSL in the way) and comparing performance from version 5 to 6, but it’s the first time we hear of possible problems with the parser so there might be something else going on.
Hello,
I believe I’m experiencing similar issue. After Spring Boot (2.7 → 3.4) and Hibernate (5.6.15 → 6.6.5.Final) upgrades, the very first query execution is about 40 times slower. I use Blaze on top of Spring Data JPA to build my query. I have tried to downgrade Hibernate (along with Boot) to 6.2.25.Final and 6.4.10.Final but performance was still unacceptable, a bit better (like 10 times slower) though. The query itself is quite complex but looks semantically the same for both Hibernate 5 and 6. Posting my profiler run here, I will be happy to send more details in PM.
Please try to create a reproducer with our test case template and if you are able to reproduce the issue, create a bug ticket in our issue tracker and attach that reproducer.
Sorry for not responding earlier. I have been tasked with other stuff.
I did manage to build the query with just JPQL and the performance is nearly the same as with QueryDSL.
But, I downgraded hibernate-core to 6.2.33.Final and the query execution time did improve significantly. With version 6.6.5 the query took around 2.8 seconds to execute, whereas with version 6.2.33.Final it only took around 0.5 seconds (roughly measured with a unit test).
(Out of interest I also tried with version 6.3.2.Final and where it took around 0.7 seconds.)
Interestingly, the flame graphs for the different versions look similar it just seems to take longer.
I suppose it has something to do with the predicates as the query uses many. When I have time again I will try to create an example with the test case template.
I tried to explicitly disable it but I couldn’t figure out how to do it in a Spring Boot Data JPA project. Do you know how to do that?
I figured it out - you have to use spring.jpa.properties.hibernate.query.plan_cache_enabled in your application.properties.
However, this wasn’t the culprit of the performance decrease.
Thanks for taking the time to reproduce the problem. This is very valuable and will hopefully help us fix the problem. Could you please also create an issue on our issue tracker and link to this discussion as well as your repo?
After upgrade to hibernate 6.4.10.Final, after select from Db, there are step extract JDBC value, this impacts to performance ?, hibernate 5.x has no this step
Format for the console2025-03-11 09:01:36 - (EntityResultInitializer) Done materializing entityInstance : com.dhl.pos.model.ParcelRatingEngine(104)#68425
Format for the console2025-03-11 09:01:36 - Calling top-level assembler (0 / 1) : org.hibernate.sql.results.graph.entity.internal.EntityAssembler@54e79b3b
Format for the console2025-03-11 09:01:36 - Extracted JDBC value [0] - [68426]
Format for the console2025-03-11 09:01:36 - (EntityResultInitializer) Hydrated EntityKey (com.dhl.xxx.model.xxx(104)): 68426
Format for the console2025-03-11 09:01:36 - (EntityResultInitializer) Created new entity instance [com.dhl.xxx.model.xxx(104)#68426] : 1105905217
Many short live object created, cause GC trigger sequenly, impact to performance, I dont know what i understand correct or not, please help me explain